Physical simulations for Mobile Robots
Simulation made while in Team KJSCE Robocon for mobile robots and their mechanisms. Simulations include path planning and projectile motion.
Simulations made at Team KJSCE Robocon for Robocon-2019 competition. Simulations include path planning for a swerve drive system and a projectile mechanism.
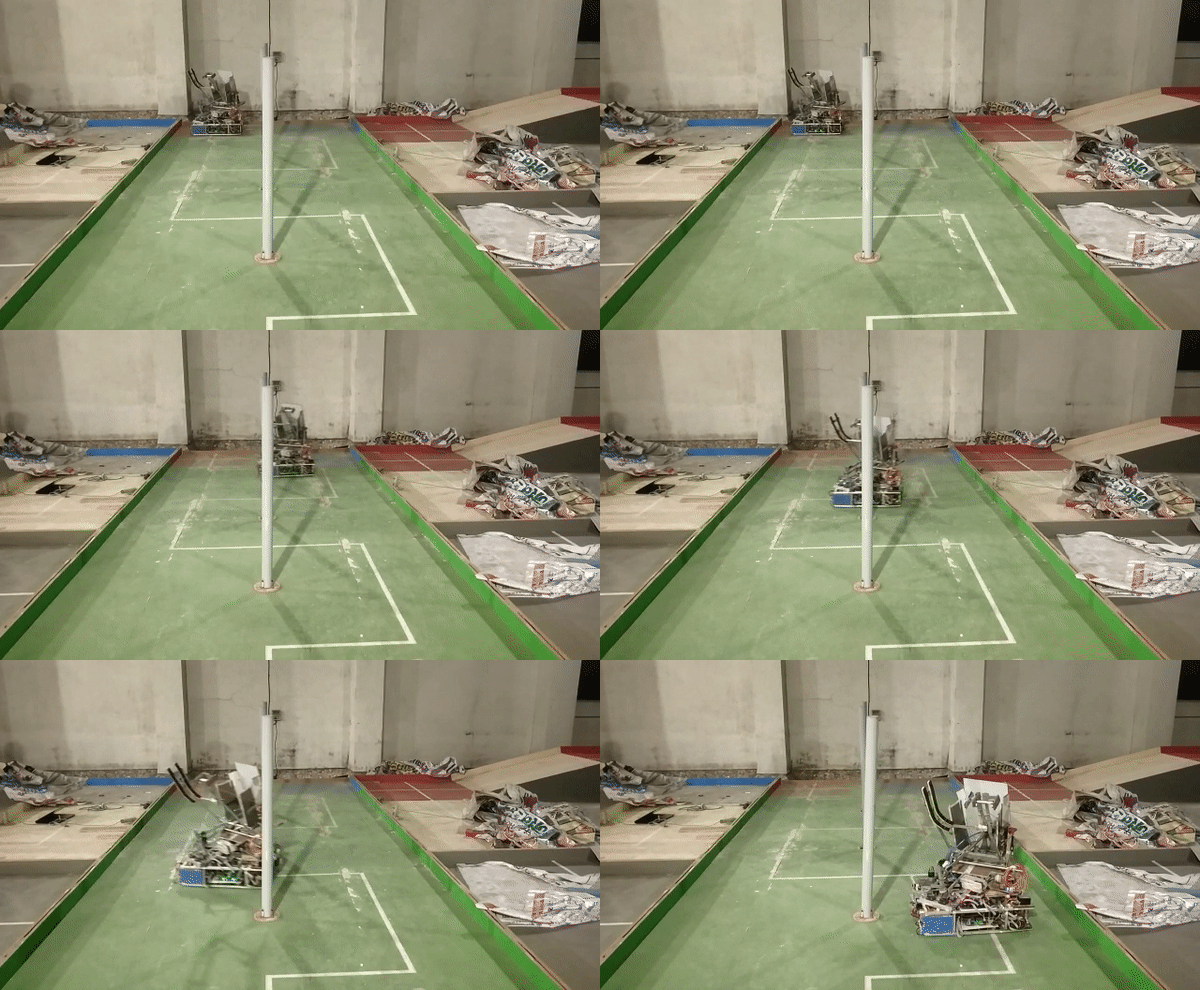
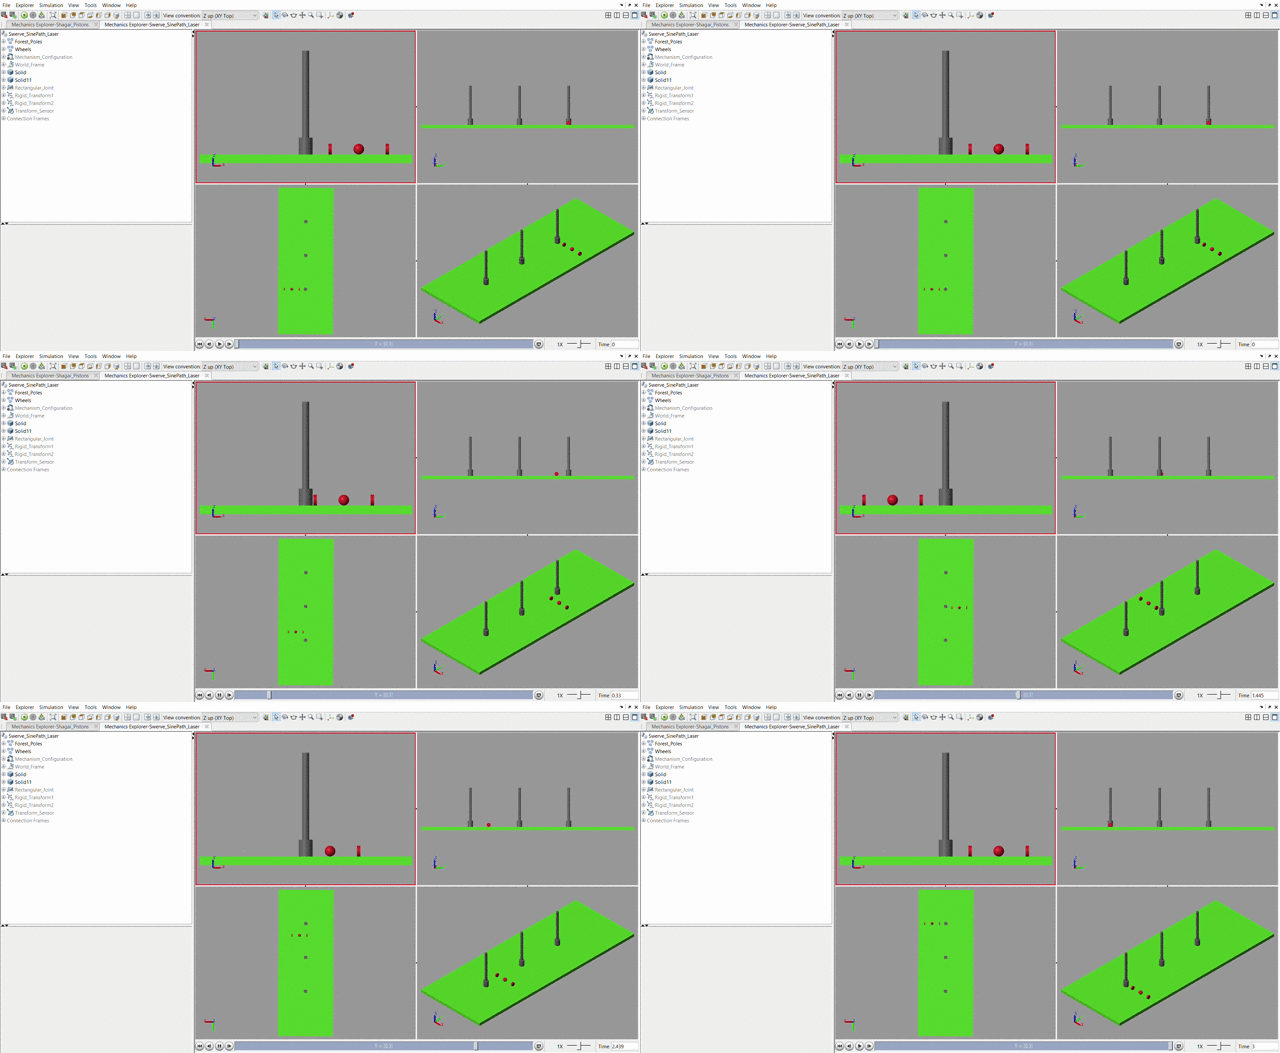
Path Planning
The idea was to be able to approximate the actual path to be traversed with our input equation. This helped us find minute violations and errors that Robot could make such as touching the poles, running into the fence.
Projectile Mechanism
Fine Tuning was done for the Model to exactly replicate the Robot’s Throw. The Score obtained after each throw, mass of Shagai and Angle of projection was noted. After physically testing the collected data, the model correctly identified the outcome in at least 95% of the cases.
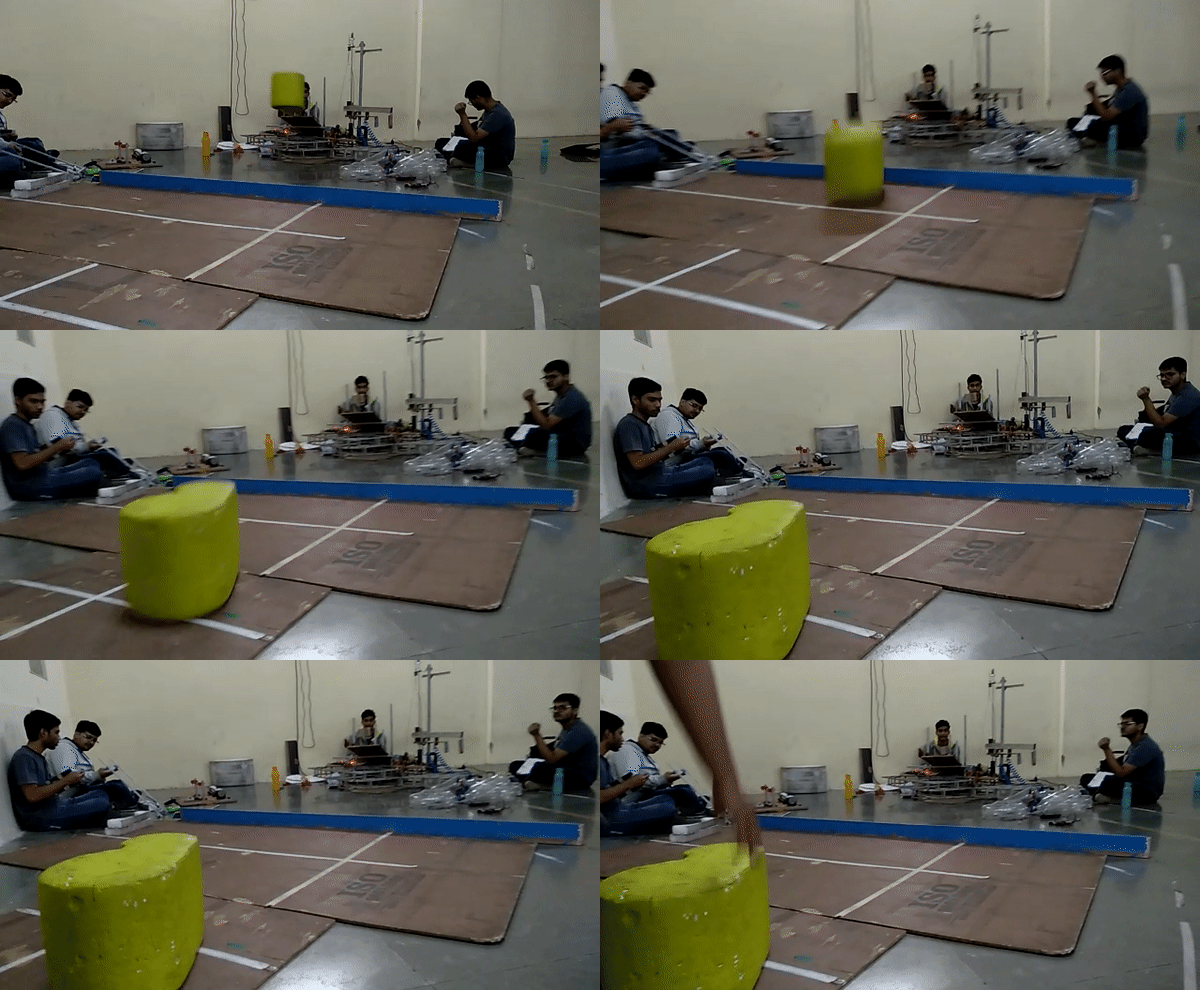
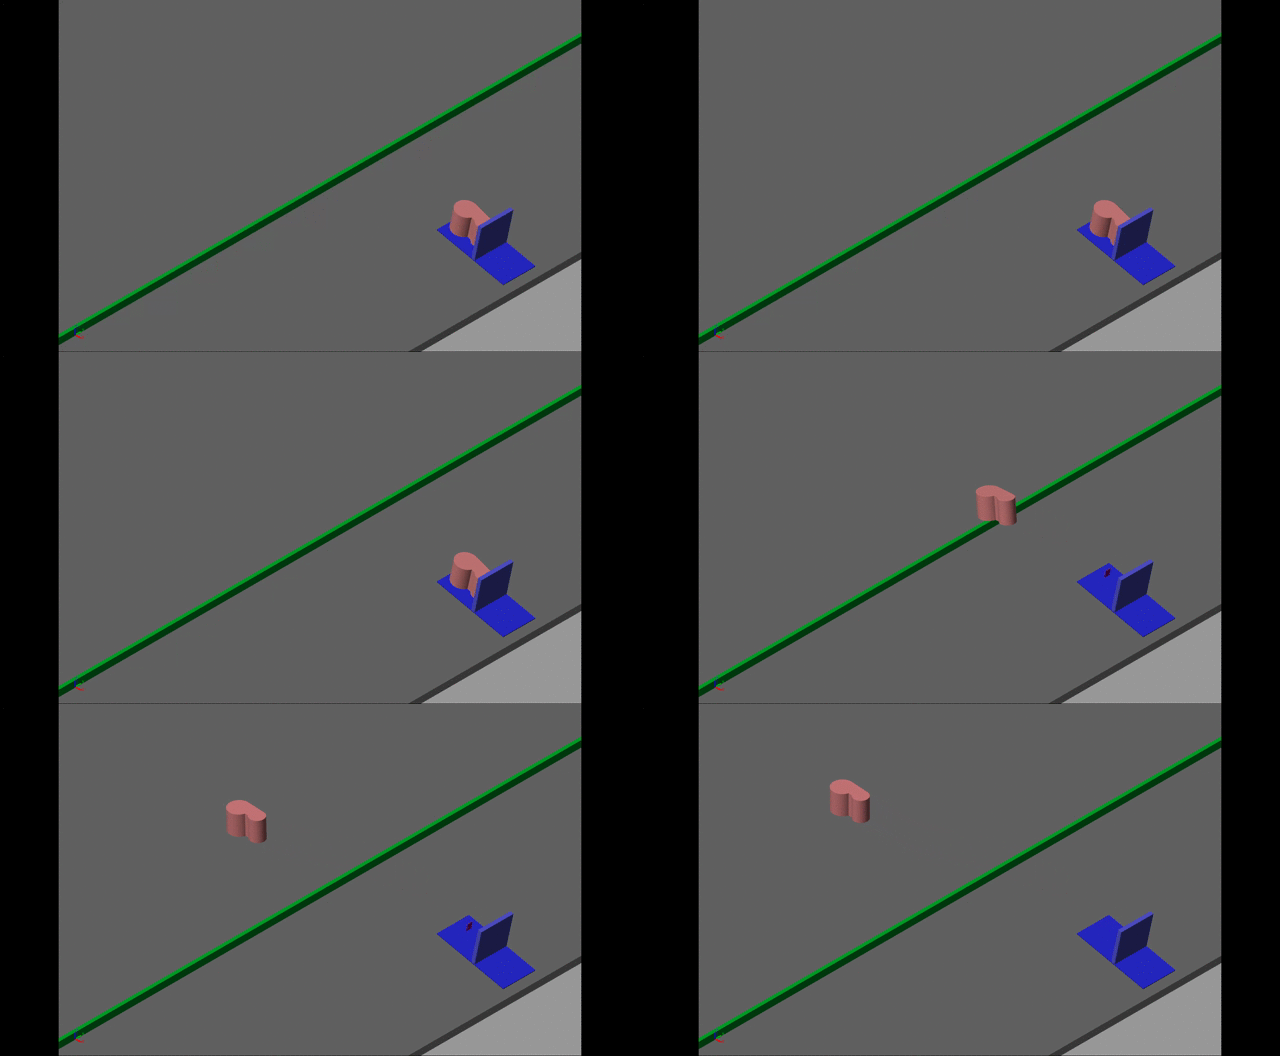
The purpose of the Shagai Throwing Model was to predict the outcome for any giving variation in the conditions. The goal was to ensure that the Shagai lands with the Golden Side on top and thus obtain 50 pts, the maximum score.
The data was collected from a loop based program which would change the angle of projection from 8.0 to 14.2. After every loop the mass of the Shagai is changed (the Shagai mass can vary from 600g to 800g as mentioned in Robocon 2019 Rulebook).
Data Collected reflected the Shagai Landing Orientation for Various Angles for Shagai of different masses. Analyzing it helped us find the ideal conditions to throw the Shagai which would result in 50 points.
In order to Visualize this data a graph was created with the outcome of the Shagai throw (20, 40, 50 points) on the Y-axis against the Angle in the X-axis. Multiple lines were drawn, each representing a Shagai of a different mass. The range of angles most suitable for the projection was then selected.
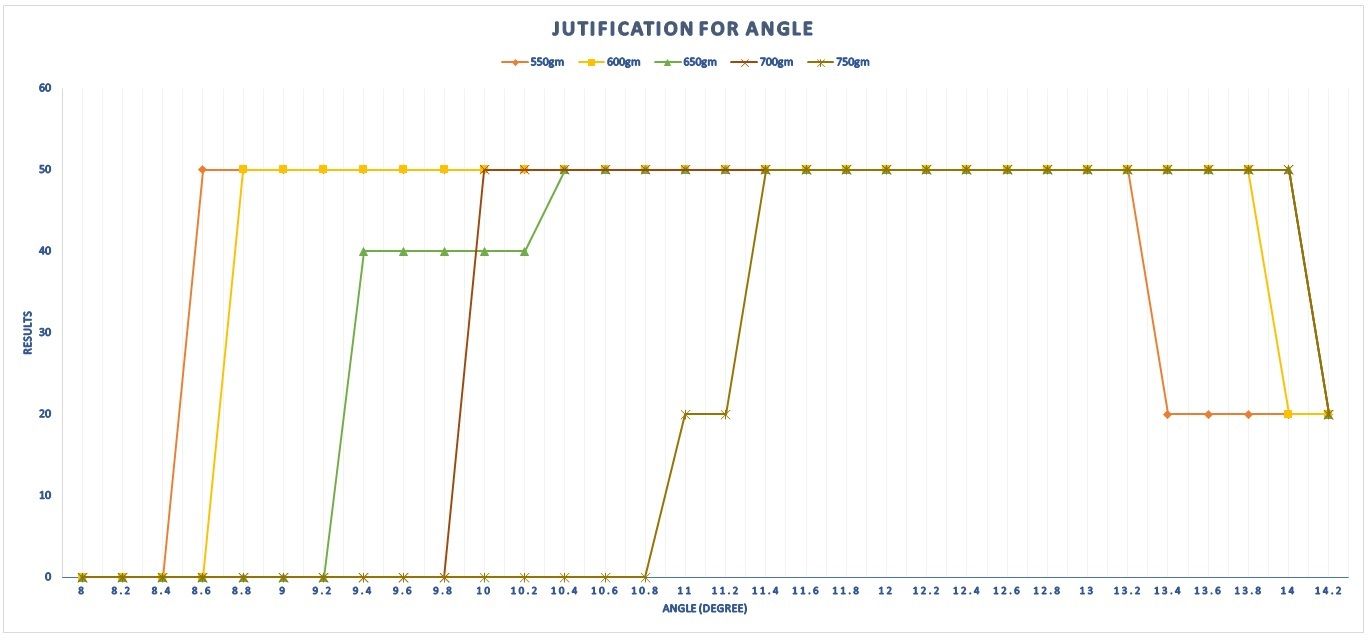
The purpose of this graph was to decide the Angle at which we were to throw the shagai from, the problems here were the variation of weights, now with the help of our Simscape model of Shagai projection, we were able to determine the appropriate angle to launch the Shagai at.
What the Graph means:
The x-axis denotes the angle at which we launched the shagai, the y-axis denotes the result attained after falling in the landing zone. The graph has 5 different lines, each being a shagai of different mass.
We then deduce for observation that the safe zone to launch the shagai is the period 11.4 to 13.2 degrees, since, it is the point wherin the Shagai lands on 50 irrespective of the weight.
Link to repository: https://github.com/veedata/Robocon2019-MATLAB